监控平台搭建(2)-环境搭建 介绍 记录搭建的命令,只提供基本的注释
系统:ubuntu-24.04-amd64
镜像:ubuntu-24.04-live-server-amd64.iso
初步搭建 查看ubuntu时区是否正确,否则发送告警模板时时间对不上
参考文章:修改时区
Prometheus 1 2 3 4 5 6 7 8 9 10 11 12 13 14 15 cd ~ export VERSION=2.53.1 curl -LO https://github.com/prometheus/prometheus/releases/download/v2.53.1/prometheus-$VERSION.linux-amd64.tar.gz tar -xzf prometheus-${VERSION}.linux-amd64.tar.gz sudo mv prometheus-${VERSION}.linux-amd64/ /usr/local/prometheus cd /usr/local/prometheus mkdir -p data sudo chmod +x prom* sudo cp -rp promtool /usr/bin/ sudo vim /usr/lib/systemd/system/prometheus.service
/usr/lib/systemd/system/prometheus.service如下:
1 2 3 4 5 6 7 8 9 10 11 12 [Unit] Description=Prometheus server daemon Documentation=https://prometheus.io/ After=network.target [Service] Type=simple ExecStart=/usr/local/prometheus/prometheus --config.file=/usr/local/prometheus/prometheus.yml --storage.tsdb.path=/usr/local/prometheus/data --web.enable-lifecycle Restart=on-failure [Install] WantedBy=multi-user.target
1 2 3 4 sudo systemctl daemon-reload sudo systemctl start prometheus sudo systemctl status prometheus sudo systemctl enable prometheus
localhost:9090验证
node exporter 1 2 3 4 5 6 7 8 cd ~ curl -OL https://github.com/prometheus/node_exporter/releases/download/v1.8.2/node_exporter-1.8.2.linux-amd64.tar.gz tar -xzf node_exporter-1.8.2.linux-amd64.tar.gz sudo mv node_exporter-1.8.2.linux-amd64/ /usr/local/node_exporter sudo vim /usr/lib/systemd/system/node_exporter.service
/usr/lib/systemd/system/node_exporter.service配置文件:
1 2 3 4 5 6 7 8 9 [Unit] Description=node_exporter [Service] ExecStart=/usr/local/node_exporter/node_exporter --web.listen-address=:9100 --collector.systemd --collector.systemd.unit-whitelist="(ssh|docker|rsyslog|redis-server).service" --collector.textfile.directory=/usr/local/node_exporter/textfile.collected Restart=on-failure [Install] WantedBy=multi-user.target
1 2 3 4 sudo systemctl daemon-reload sudo systemctl start node_exporter sudo systemctl status node_exporter sudo systemctl enable node_exporter
将node exporter添加到Prometheus中:
1 2 3 4 5 6 7 8 sudo vim /usr/local/prometheus/prometheus.yml ...... - job_name: "node_exporter" static_configs: - targets: ["localhost:9100"] # 刷新Prometheus配置 curl -X POST http://localhost:9090/-/reload
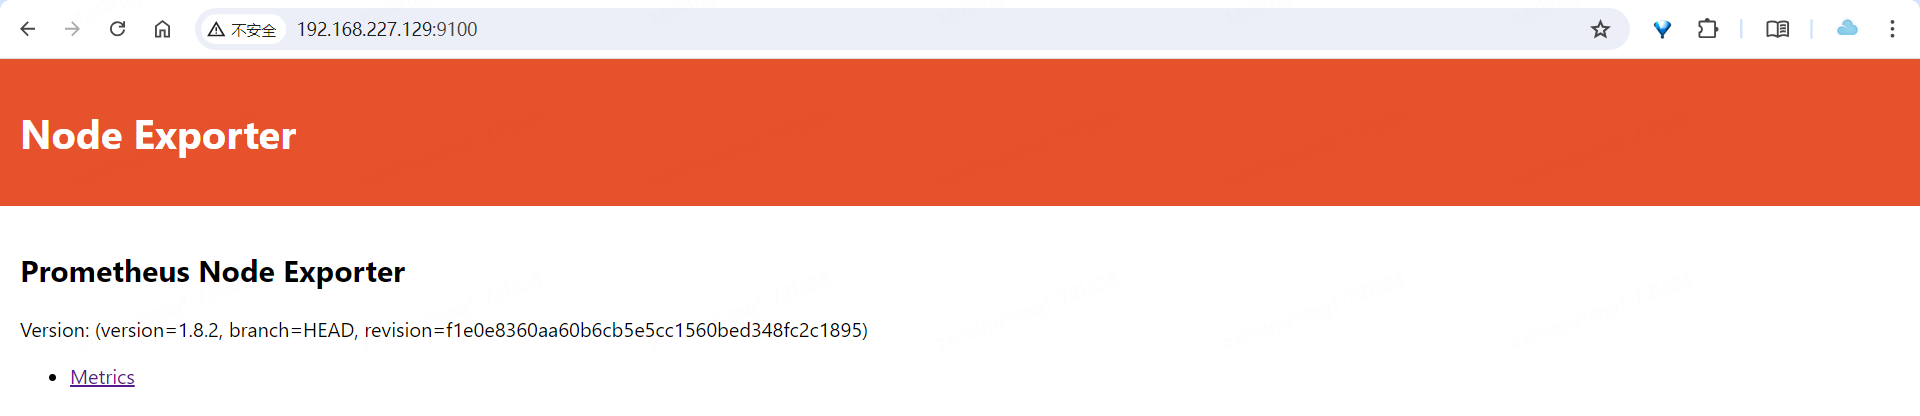
访问localhost:9100
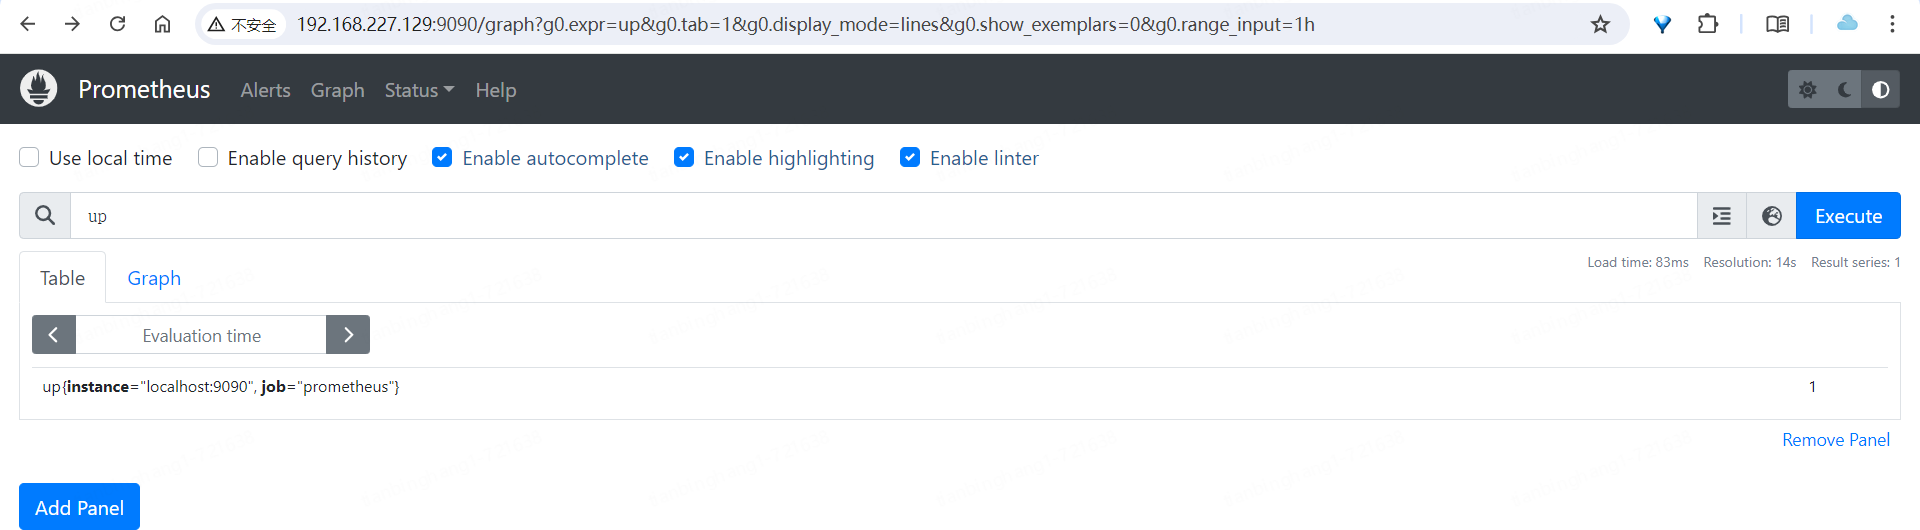
在Prometheus中输入up,查看服务是否正确连接
Grafana 1 2 3 4 5 6 7 8 9 10 11 cd ~ sudo apt-get upgrade sudo apt-get install -y adduser libfontconfig1 musl wget https://dl.grafana.com/enterprise/release/grafana-enterprise_11.1.0_amd64.deb sudo dpkg -i grafana-enterprise_11.1.0_amd64.deb sudo systemctl daemon-reload sudo systemctl start grafana-server sudo systemctl status grafana-server sudo systemctl enable grafana-server
访问localhost:3000
账号密码均为admin
导入Prometheus数据源
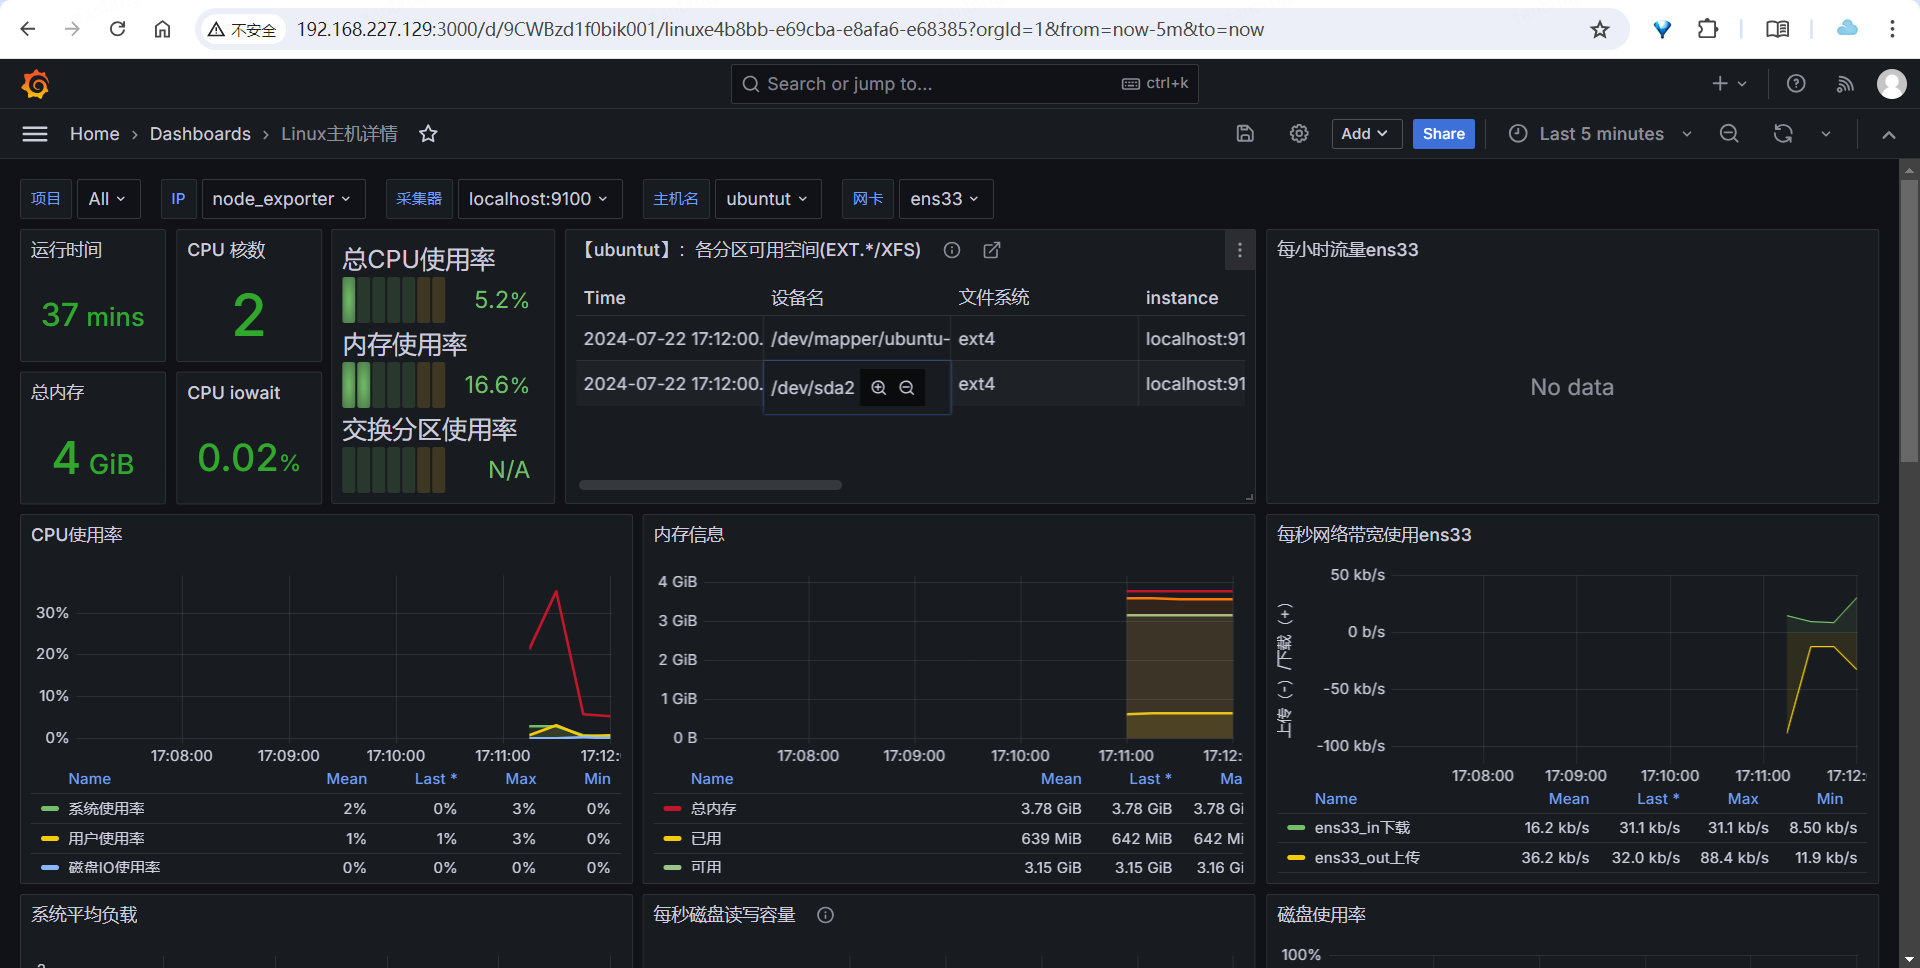
导入模板12633,查看系统状况
MySQL 1 2 3 4 5 6 7 8 9 10 11 12 13 14 15 16 17 18 19 20 21 22 23 24 25 26 27 28 29 30 31 32 33 34 sudo apt update sudo apt install mysql-server sudo systemctl daemon-reload sudo systemctl start mysql sudo systemctl status mysql sudo systemctl enable mysql # 查看初始的账号密码 sudo cat /etc/mysql/debian.cnf mysql -u<账号> -p # 修改root密码(mysql8.0) ALTER USER 'root'@'localhost' IDENTIFIED WITH mysql_native_password BY '新密码'; FLUSH PRIVILEGES; # 重新使用root登录 mysql -uroot -p # 查看用户目前的权限 use mysql; select Host,User from user where user='root'; # 如果要将root修改为外网可访问,之后的localhost换为% [该SQL根据情况可选] update user set Host='%' where User ='root'; # 授权【前面改为%的话就要跟着变】 GRANT ALL PRIVILEGES ON *.* TO 'root'@'localhost' WITH GRANT OPTION; # 刷新 FLUSH PRIVILEGES; # 创建新账号 # 说明:为用户设置最大连接限制,以避免在重负载下监控抓取使服务器过载。 CREATE USER 'exporter'@'%' IDENTIFIED BY 'prometheus' WITH MAX_USER_CONNECTIONS 3; GRANT PROCESS, REPLICATION CLIENT, SELECT ON *.* TO 'exporter'@'%'; flush privileges;
mysqld exporter 1 2 3 4 5 6 7 8 9 10 11 12 13 14 15 16 17 18 19 20 21 22 23 24 25 26 27 28 29 30 31 32 cd ~ curl -LO https://github.com/prometheus/mysqld_exporter/releases/download/v0.15.1/mysqld_exporter-0.15.1.linux-amd64.tar.gz tar -xzf mysqld_exporter-0.15.1.linux-amd64.tar.gz sudo mv mysqld_exporter-0.15.1.linux-amd64/ /usr/local/mysqld_exporter/ cd /usr/local/mysqld_exporter cat > .my.cnf <<EOF [client] user=exporter password=prometheus EOF # 启动 默认端口9104 ./mysqld_exporter --config.my-cnf=.my.cnf # 使用systemd方式启动 sudo vim /usr/lib/systemd/system/mysqld_exporter.service [Unit] Description=Prometheus [Service] ExecStart=/usr/local/mysqld_exporter/mysqld_exporter --config.my-cnf=/usr/local/mysqld_exporter/.my.cnf Restart=on-failure [Install] WantedBy=multi-user.target sudo systemctl daemon-reload sudo systemctl start mysqld_exporter sudo systemctl enable mysqld_exporter sudo systemctl status mysqld_exporter
配置到Prometheus中
1 2 3 4 5 6 7 8 9 10 11 12 sudo vim /usr/local/prometheus/prometheus.yml ...... - job_name: 'mysqld_exporter' static_configs: - targets: ['localhost:9104'] labels: app: mysqld_exporter node: node1 role: mysqld_exporter # 刷新Prometheus配置 curl -X POST http://localhost:9090/-/reload
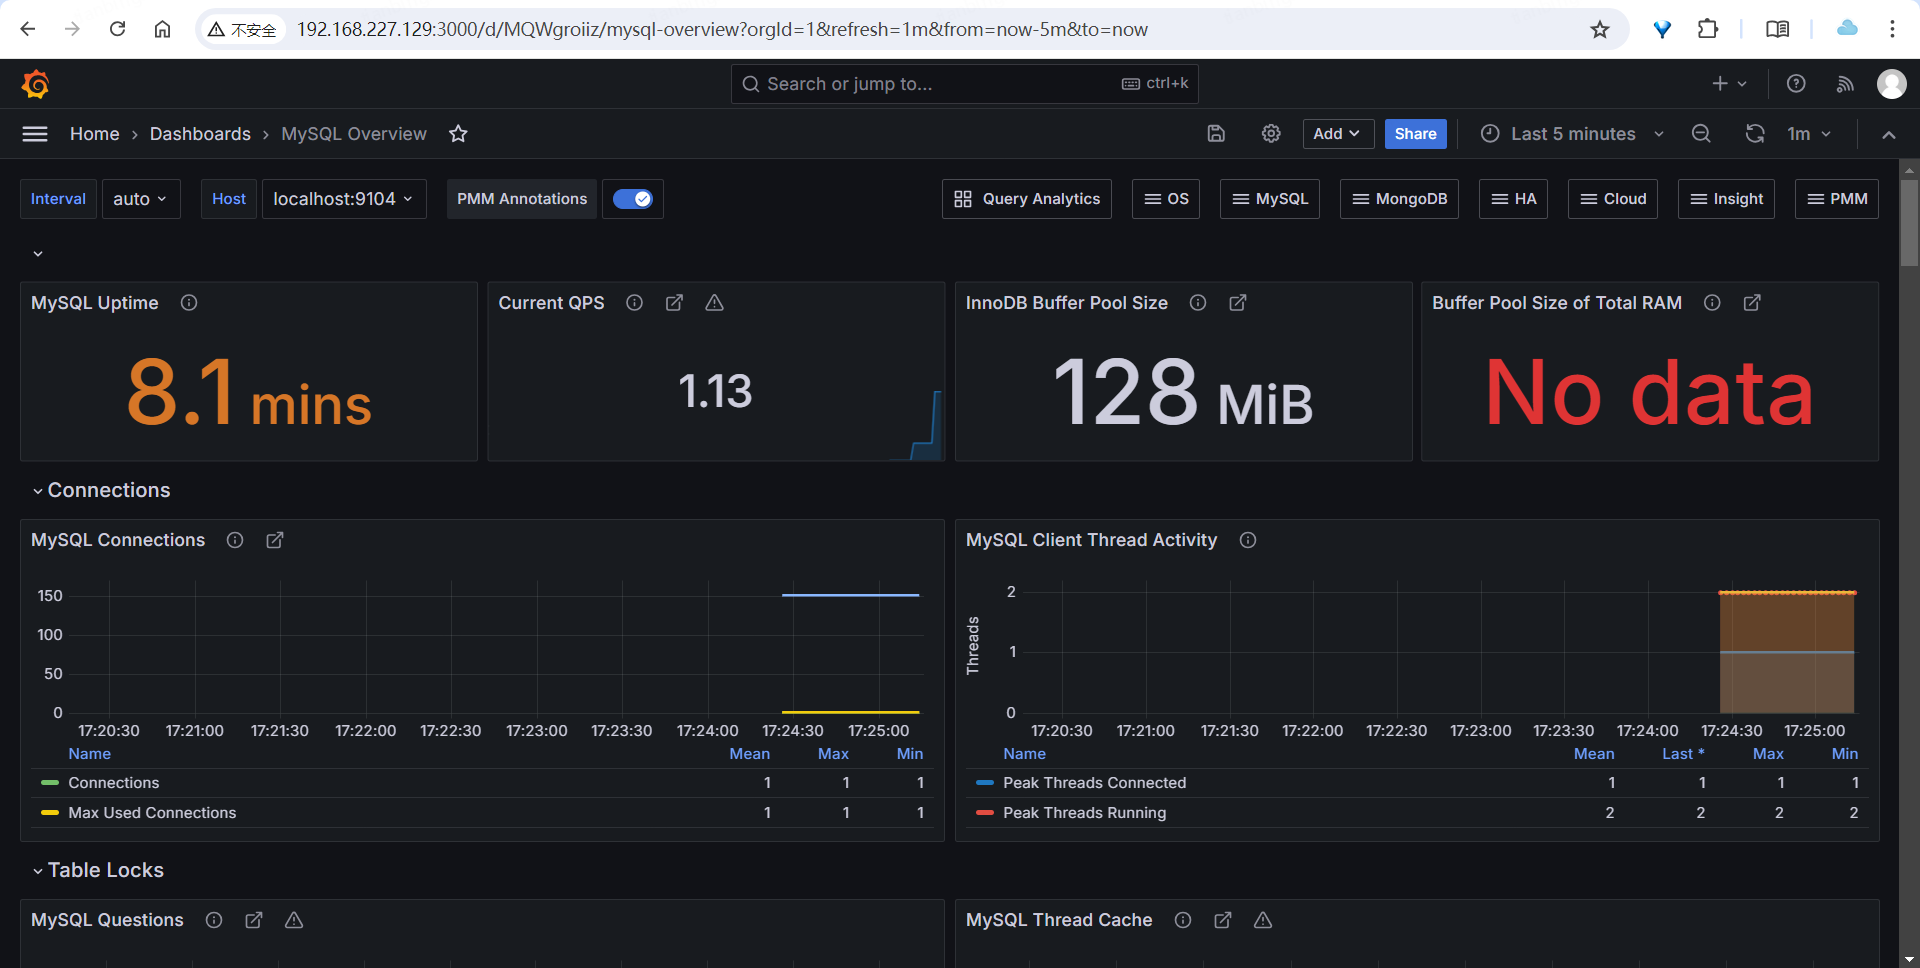
Grafana导入模板7362
Grafana配置 根据需要 导入相关模板,监控Springboot应用可以使用:21319 模板
模板虽然好用 但大多情况无法满足我们的具体需求,尤其是具体应用,需要根据埋点上报的具体指标 灵活改动,并且模板中的信息堆放比较杂,我们需要把它们合并到一块方便查看
关于Grafana的具体配置会在 [4. 可视化](./4. 可视化.md) 详细介绍
告警 AlertManager 1 2 3 curl -LO https://github.com/prometheus/alertmanager/releases/download/v0.27.0/alertmanager-0.27.0.linux-amd64.tar.gz tar -xzf alertmanager-0.27.0.linux-amd64.tar.gz sudo mv alertmanager-0.27.0.linux-amd64/ /usr/local/alertmanager/
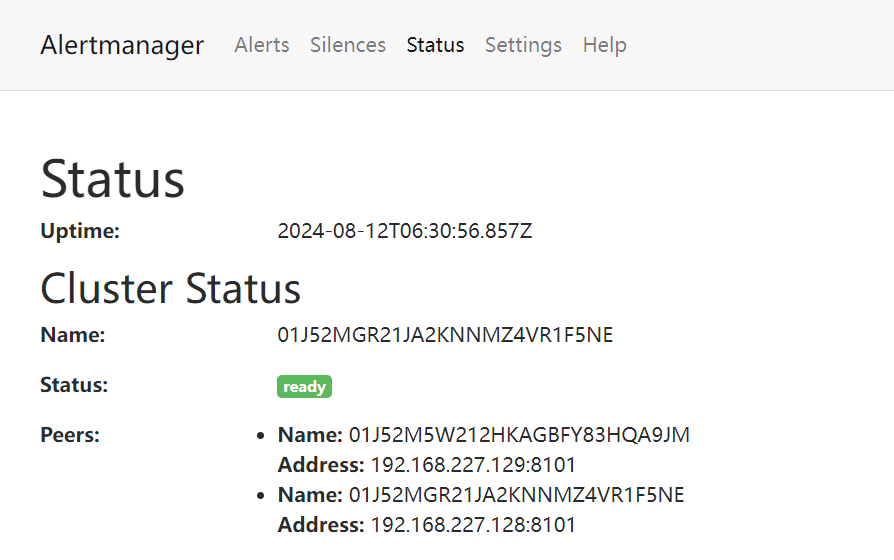
下面是构建集群,Gossip协议
1 2 3 4 5 # 主机1 ./alertmanager --web.listen-address=":9093" --cluster.listen-address="192.168.227.129:8101" # 主机2 ./alertmanager --web.listen-address=":9093" --cluster.listen-address="192.168.227.128:8101" --cluster.peer=192.168.227.129:8101
检查一下运行是否正常
没问题后设置自启动
P1:
1 2 3 4 5 6 7 8 9 10 11 12 13 14 sudo vim /usr/lib/systemd/system/alertmanager.service [Unit] Description=AlertManager After=network.target [Service] ExecStart=/usr/local/alert_manager/alertmanager --web.listen-address=":9093" --cluster.listen-address="192.168.227.129:8101" --config.file=alertmanager.yml --log.level=debug --log.format=json Restart=on-failure [Install] WantedBy=multi-user.target sudo systemctl daemon-reload sudo systemctl start alertmanager sudo systemctl enable alertmanager sudo systemctl status alertmanager
P2:
1 2 3 4 5 6 7 8 9 10 11 12 13 14 sudo vim /usr/lib/systemd/system/alertmanager.service [Unit] Description=AlertManager After=network.target [Service] ExecStart=/usr/local/alert_manager/alertmanager --web.listen-address=":9093" --cluster.listen-address="192.168.227.128:8101" --cluster.peer=192.168.227.129:8101 --config.file=alertmanager.yml --log.level=debug --log.format=json Restart=on-failure [Install] WantedBy=multi-user.target sudo systemctl daemon-reload sudo systemctl start alertmanager sudo systemctl enable alertmanager sudo systemctl status alertmanager
具体告警配置:[5. 告警配置](./5. 告警配置.md)
mtail监控日志
具体日志告警配置:不出意外的话,会在“监控平台搭建(6)-日志告警”文章中