监控平台搭建(3)-Springboot埋点 采集需求 Springboot应用需要监控的场景:
JVM的具体情况
接口的TP90、最大响应时长、平均响应时长、QPS
监控接口的进阶要求
根据入参进行分类
内部调用其他接口(如外部数据源),监控指标同上
接口http响应码,内部业务code码,根据code统计失败率
项目出现问题,发送自定义指标,配置告警,帮助快速发现问题
需求分析 需求一:Springboot Actuator可以直接监控JVM信息
需求四:可以通过打印错误日志 -> mtail监控 -> 监控到指定日志,发送Metrics -> 告警 来实现,所以暂时不讨论
所以本篇文章主要讨论 需求二、需求三 的实现
Metrics类型选择 有四种数据类型:Counter(单增),Gauge(可增可减),Histogram(桶/直方图),Summary(摘要)
Summary(摘要) 是 客户端 直接计算出 用户指定的分位点,然后上报Prometheus
Histogram(桶/直方图) 是 Prometheus 根据 桶分布情况 估算 分位点
数据上报:
Histogram类型上报的数据:桶、max、count、sum
Summary类型上报的数据:分位点、max、count、sum
Histogram VS Summary
Histogram
客户端性能消耗小,服务端查询分位数时消耗大。
可以在查询期间自由计算各种不同的分位数。
分位数的精度无法保证,其精确度受桶的配置、数据分布、数据量大小情况影响。
可聚合,可以计算全局分位数。
客户端兼容性好。
Summary
客户端性能消耗大(因为分位数计算发生在客户端),服务端查询分位数时消耗小。
只能查询客户端上报的哪些分位数。
分位数的精度可以得到保证,精度会影响客户端的消耗。
不可聚合,无法计算全局分位数(因此不支持多实例,平行扩展的 http 服务)。
客户端兼容性不好。
大多数场景使用 Histogram 更为灵活。
现在来分析下需求二、三:
如果我们只使用Histogram类型统计接口
通过max可以统计最大响应时间
Prometheus可以根据桶估算分位点
根据区间内的sum和count可以计算平均响应时长
综上,对于我们的需求,只采用Histogram即可解决
埋点实现 下面会从头介绍我个人的探索过程,省流:方案一不可用,不感兴趣可以直接从方案二开始看起
留着 方案一 是因为确实写了一篇文档,也打算这么来搞,但最终发现不可行,也无法通过其它方式补救
方案一 @Timed 我们可以使用springboot actuator进行监控,而它底层按照micrometer的规范实行,导入micrometer-registry-prometheus即可将数据转为Prometheus的Metrics格式进行上报
同时,我们可以使用micrometer提供的@Timed进行监控埋点,它是通过AOP来实现的,所以需要导入spring-boot-starter-aop,同时也记得开启@EnableAspectJAutoProxy
1 2 3 4 5 6 7 8 9 10 11 12 13 <dependency > <groupId > org.springframework.boot</groupId > <artifactId > spring-boot-starter-actuator</artifactId > </dependency > <dependency > <groupId > io.micrometer</groupId > <artifactId > micrometer-registry-prometheus</artifactId > <scope > runtime</scope > </dependency > <dependency > <groupId > org.springframework.boot</groupId > <artifactId > spring-boot-starter-aop</artifactId > </dependency >
接着添加相关配置
1
2
3
4
5
6
7
8
9
10
11
12
13
management: server: port: 8092 endpoints: web: exposure: include: "*" metrics: tags: application: ${spring.application.name}
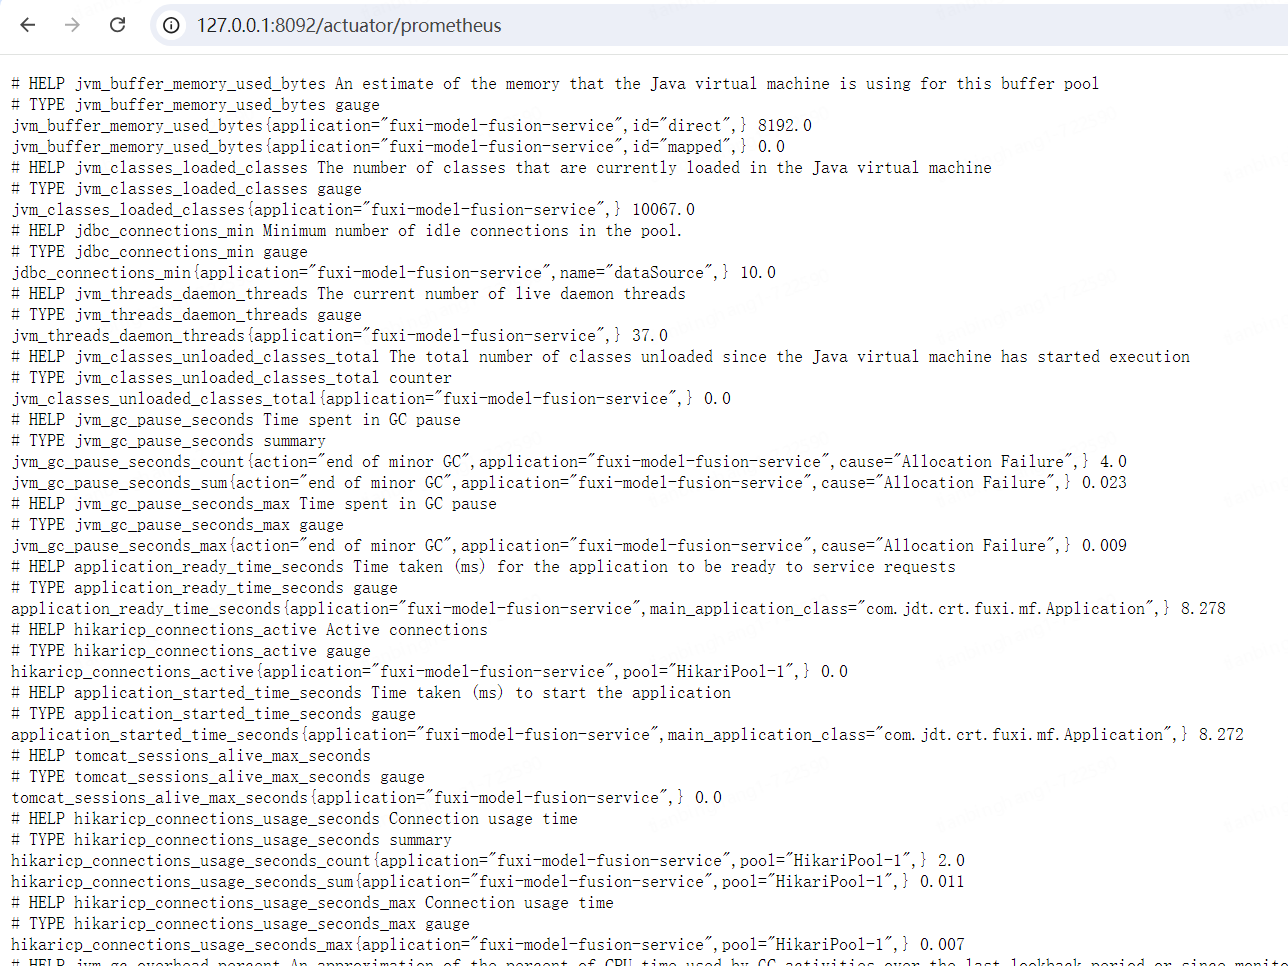
启动后,查看localhost:8092/actuator即可查看所有的监控指标,而localhost:8092/actuator/prometheus则是要上报Prometheus的指标
下面是关于@Timed的使用:
1
2
3
4
5
6
7
8
9
10
11
12
13
14
15
16
17
18
19
20
21
22
23
package io.micrometer.core.annotation;import java.lang.annotation.*;@Target({ElementType.ANNOTATION_TYPE, ElementType.TYPE, ElementType.METHOD}) @Repeatable(TimedSet.class) @Retention(RetentionPolicy.RUNTIME) @Inherited public @interface Timed { String value () default "" ; String[] extraTags() default {}; boolean longTask () default false ; double [] percentiles() default {}; boolean histogram () default false ; String description () default "" ; }
在使用前我们需要将包内提供的TimeAspect创建为bean,详细参考:Timer(一)之@Timed初探
1
2
3
4
5
6
7
@Configuration public class springConfig { @Bean public TimedAspect timedAspect (MeterRegistry registry) { return new TimedAspect (registry, tagsBasedOnJoinPoint); } }
举个简单的例子
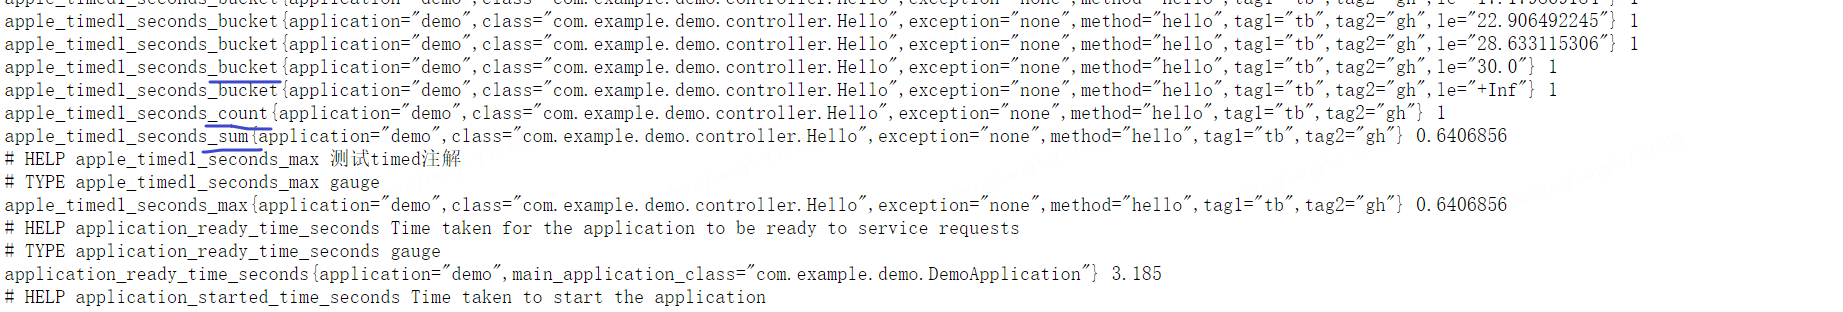
1 @Timed(value = "apple.timed1" ,description = "测试timed注解", histogram = true, extraTags = {"tag1","tbg","tag2","hg"})
名称默认会以.进行分割然后转换,到Prometheus后,为apple_timed1
上报的指标包括bucket、count、sum、max四种
但是只有这些指标,肯定没有办法满足需求,例如:
如何动态的指定标签,或者说如何将接口的入参作为标签
如何将header中的字段添加到标签中
首先看源码上的注释:
1
2
AspectJ aspect for intercepting types or methods annotated with @Timed. The aspect supports programmatic customizations through constructor-injectable custom logic. You might want to add tags programmatically to the Timer. In this case, the tags provider function (Function<ProceedingJoinPoint, Iterable<Tag>>) can help. It receives a ProceedingJoinPoint and returns the Tags that will be attached to the Timer.
1
2
3
4
5
6
7
private final Function<ProceedingJoinPoint, Iterable<Tag>> tagsBasedOnJoinPoint;... public TimedAspect (MeterRegistry registry, Function<ProceedingJoinPoint, Iterable<Tag>> tagsBasedOnJoinPoint) { this (registry, tagsBasedOnJoinPoint, DONT_SKIP_ANYTHING); }
通过tagsBasedOnJoinPoint,我们可以自行添加标签,入参为ProceedingJoinPoint,我们可以轻松的获得方法的具体信息,下面给个例子
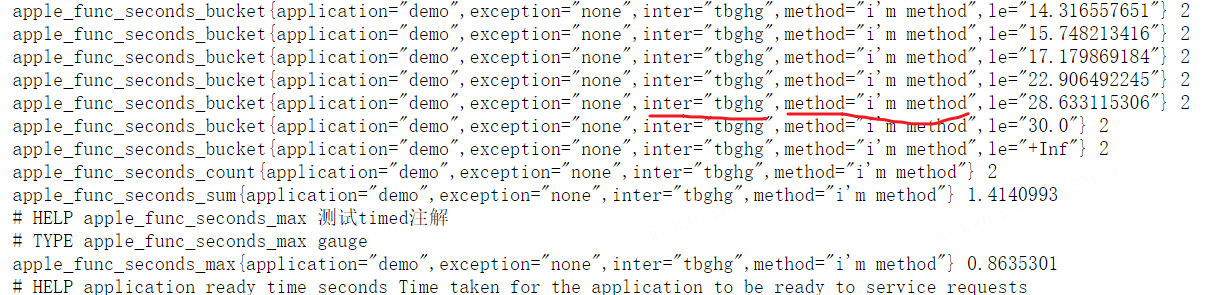
1
2
3
4
5
6
7
8
9
10
11
12
13
14
15
16
17
18
19
20
21
22
23
24
25
26
27
28
29
30
@Configuration public class springConfig { @Bean public TimedAspect timedAspect (MeterRegistry registry) { return new TimedAspect (registry, tagsBasedOnJoinPoint); } Function<ProceedingJoinPoint, Iterable<Tag>> tagsBasedOnJoinPoint = joinPoint -> { List<Tag> tags = new ArrayList <>(); tags.add(Tag.of("method" , "i'm method" )); MethodSignature methodSignature = (MethodSignature) joinPoint.getSignature(); String[] parameterNames = methodSignature.getParameterNames(); Object[] args = joinPoint.getArgs(); for (int i = 0 ; i < parameterNames.length; i++) { if ("inter" .equals(parameterNames[i])) { tags.add(Tag.of("inter" , args[i].toString())); break ; } } return tags; }; }
可以看到,标签成功打上去了,inter中是我们传入的参数
至于header,可以从入参中取HttpServletRequest类型,从中取数据
问题 但是后面发现,这种方式无法获取到方法返回值,那么就无法获取返回的业务code或者http状态码等等,无法根据返回结果打标签,但是这种场景又很必须,例如根据业务code统计失败率,出现某些业务code后进行告警等等
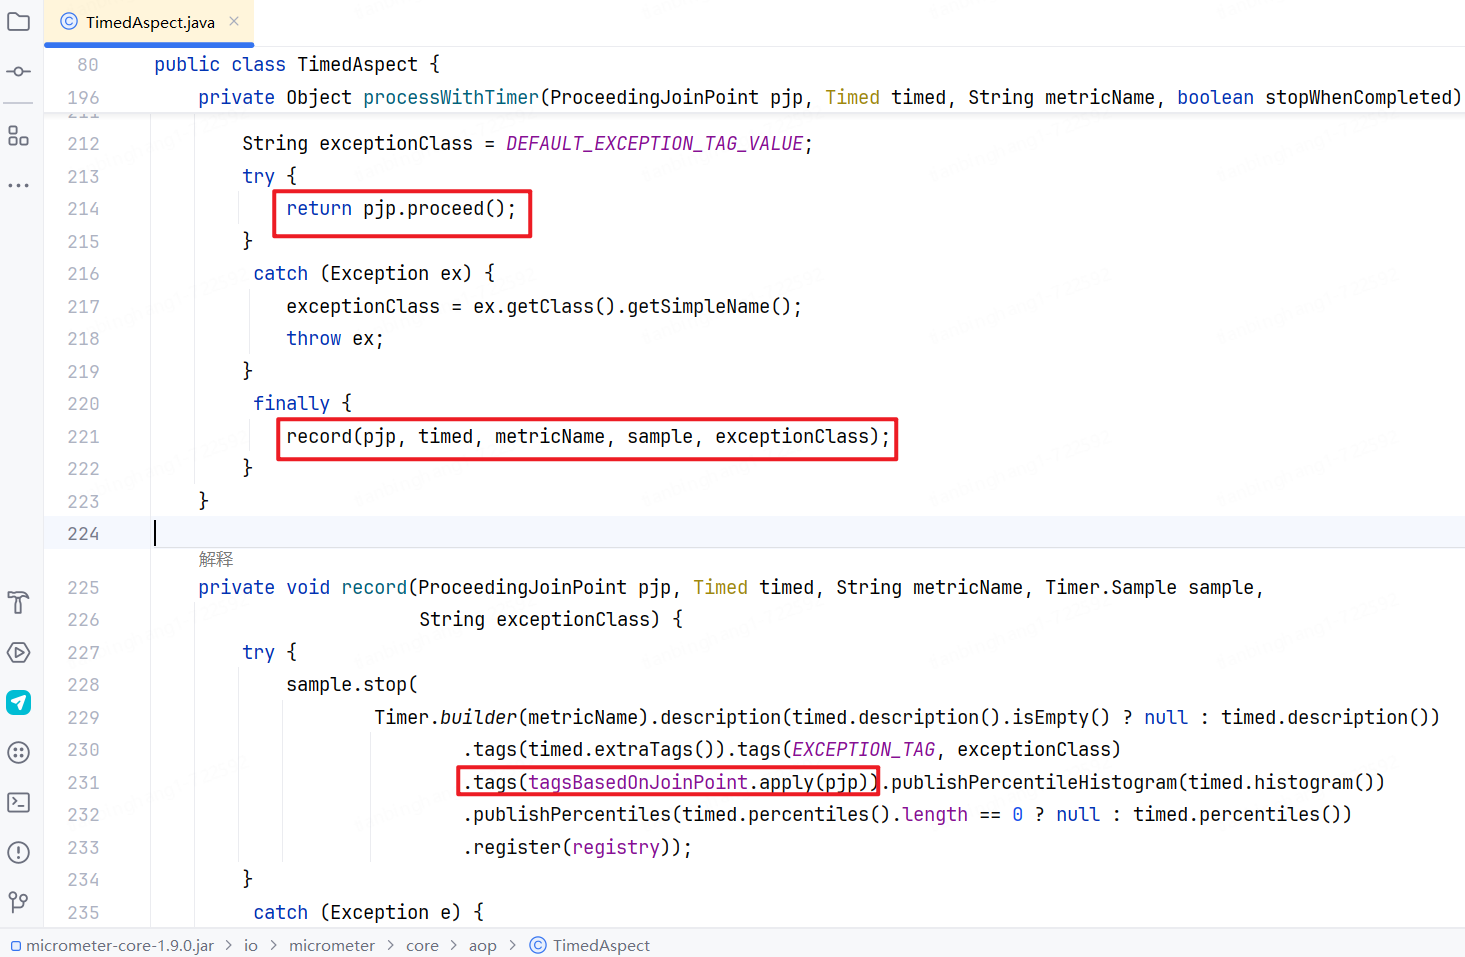
该部分源码如下:
过程如下:执行原方法 -> 调用我们自定义的tagsBasedOnJoinPoint.apply方法 ->上报指标
因为自定义方法中含有ProceedingJoinPoint连接点,还是有一定操作空间,所以现在的目标就变成了:对于一个已执行完毕的方法,通过反射等途径,获取之前的执行结果并使用
当时考虑了下面的方法:
方法执行完成后 再通过一个切面(如@AfterReturning)来获取返回值
将返回值记录,保证之后可以通过连接点取到返回值
如何记录:通过反射,在方法中添加参数
实现时发现,反射获取到参数后为数组类型,只能修改,无法添加,所以引申出一种自暴自弃式做法:
所有要监控的方法多一个result参数,统一写到这个里面【这个方案一旦交上去,估计第二天就从公司毕业了,所以就废弃掉了】
方案二 自行实现AOP 分析 虽说是自行实现,但是可以注意到,TimedAspect是以Bean的形式注入的,我们只要自行实现一个@Timed的切面即可,并且TimedAspect中大部分实现可以参考,我们只需要在result小修一下。
既然要重新实现,那就实现一个更为完善的吧,对于自定义标签,我们可以分为两类:
Before:根据入参打标签
After:根据返回值打标签
先来看Function<ProceedingJoinPoint, Iterable<Tag>> tagsBasedOnJoinPoint,它虽然能用但却不好用,需要把所有要监控的方法的入参添加标签校验都放到这里,很容易出现彼此间的干扰,可读性较差,且后续维护会比较困难,这种类型已经无法满足我们的需求,所以直接删除相关代码
这里考虑使用策略模式,入参处理方式有各自的策略,出参处理方式有各自的策略,监控一个方法时通过注解配置它的入参出参策略标识。策略顶层定义一个抽象类,编写经常被复用的方法,权限设置为protected,对外提供 public List<Tag> getTags供获取标签结果,所有的策略注入到策略工厂中
实现 既然要在注解中定义标识,那原本的@Timed就不能用了,我们可以重新定义一个
1
2
3
4
5
6
7
8
9
10
11
12
13
14
15
16
17
18
19
20
21
import java.lang.annotation.*;@Target({ElementType.ANNOTATION_TYPE, ElementType.TYPE, ElementType.METHOD}) @Retention(RetentionPolicy.RUNTIME) @Inherited public @interface CustomTimed { String value () ; String description () default "" ; String[] extraTags() default {}; double [] percentiles() default {}; boolean histogram () default false ; String afterKey () default "" ; String beforeKey () default "" ; }
下面我们来编写Before策略的抽象类,注释比较详细就不过多解释了
1
2
3
4
5
6
7
8
9
10
11
12
13
14
15
16
17
18
19
20
21
22
23
24
25
26
27
28
29
30
31
32
33
34
35
36
37
38
39
40
41
42
43
44
45
46
47
48
49
50
51
52
53
54
55
56
57
58
59
60
61
62
63
64
65
66
67
68
69
70
71
72
73
74
75
76
77
78
public abstract class MonitorBeforeStrategy { protected abstract List<Tag> applyStrategy (ProceedingJoinPoint pjp) ; protected String[] parameterNames; protected Object[] args; public List<Tag> getTags (ProceedingJoinPoint pjp) { parameterParsing(pjp); List<Tag> tags = new ArrayList <>(); tags.add(Tag.of("class" , pjp.getStaticPart().getSignature().getDeclaringTypeName())); tags.add(Tag.of("method" , pjp.getStaticPart().getSignature().getName())); List<Tag> customTags = applyStrategy(pjp); tags.addAll(customTags); return tags; } protected List<Tag> httpTags (ProceedingJoinPoint pjp) { List<Tag> tags = new ArrayList <>(); HttpServletRequest request = null ; for (int i = 0 ; i < parameterNames.length; i++) { if (args[i] instanceof HttpServletRequest) { request = (HttpServletRequest) args[i]; break ; } } if (request == null ) { return tags; } tags.add(Tag.of("requestMethod" , request.getMethod())); tags.add(Tag.of("uri" , request.getRequestURI())); return tags; } protected void parameterParsing (ProceedingJoinPoint pjp) { MethodSignature methodSignature = (MethodSignature) pjp.getSignature(); this .parameterNames = methodSignature.getParameterNames(); this .args = pjp.getArgs(); } protected Object[] getTargetArgs(String... names) { Object[] targetArgs = new Object [names.length]; for (int j = 0 ; j < names.length; j++) { for (int i = 0 ; i < parameterNames.length; i++) { if (names[j].equals(parameterNames[i])) { targetArgs[j] = args[i]; break ; } } } return targetArgs; } }
先来看一个Before策略类的具体实现,可以发现现在添加标签就容易一些了
1
2
3
4
5
6
7
8
9
10
11
12
13
14
15
16
17
18
19
20
21
22
public class HttpMonitorBeforeStrategy extends MonitorBeforeStrategy { private final String INTERFACE_CODE = "interfaceCode" ; private final String INTERFACE_CODE_TAG = "interface_code" ; @Override protected List<Tag> applyStrategy (ProceedingJoinPoint pjp) { List<Tag> tags = new ArrayList <>(); Object[] targetArgs = getTargetArgs(INTERFACE_CODE); if (targetArgs[0 ] != null && !targetArgs[0 ].toString().isEmpty()) { tags.add(Tag.of(INTERFACE_CODE_TAG, targetArgs[0 ].toString())); } tags.addAll(httpTags(pjp)); return tags; } }
接着是After的抽象类,这里需要注意,只写个泛型肯定不行,会存在泛型擦除的情况,导致我们取出result中的参数较为困难,所以需要传递实际类型
1
2
3
4
5
6
7
8
9
10
11
12
13
14
15
16
17
18
19
20
21
22
23
24
25
26
27
28
@Slf4j public abstract class MonitorAfterStrategy <R> { protected List<Tag> tags = null ; protected R result; private final Class<R> resultType; public MonitorAfterStrategy (Class<R> resultType) { this .resultType = resultType; } protected abstract List<Tag> applyStrategy (ProceedingJoinPoint pjp) ; public List<Tag> getTags (ProceedingJoinPoint pjp, Object result) { if (result == null ) { return tags; } if (resultType.isInstance(result)) { this .result = resultType.cast(result); this .tags = applyStrategy(pjp); } else { log.error("result is not of type {}, result: {}" , this .result.getClass(), result); } return tags; } }
具体实现中我们来举两个例子,先是常规简单的,可以看到现在从结果中取数据极为方便,直接取就可以
1
2
3
4
5
6
7
8
9
10
11
12
13
14
15
16
17
18
public class RespBodyVoMonitorAfterStrategy extends MonitorAfterStrategy <RespBodyVo> { private final String CODE_TAG = "code" ; public RespBodyVoMonitorAfterStrategy () { super (RespBodyVo.class); } @Override protected List<Tag> applyStrategy (ProceedingJoinPoint pjp) { List<Tag> tags = new ArrayList <>(); String code = result.getCode(); tags.add(Tag.of(CODE_TAG, code)); return tags; } }
下面是在外面包裹了一层,并且内部使用了泛型(ResponseEntity<RespBodyVo>),在上报类型时复杂一些,首先上报一般的class,然后强转指定对应的泛型即可
1
2
3
4
5
6
7
8
9
10
11
12
13
14
15
16
17
18
19
20
21
22
23
24
25
26
27
28
29
... import org.springframework.http.ResponseEntity;@Slf4j public class WrappedRespBodyVoMonitorAfterStrategy extends MonitorAfterStrategy <ResponseEntity<RespBodyVo>> { private final String STATUS_CODE_TAG = "status_code" ; private final String BUSINESS_CODE_TAG = "business_code" ; public WrappedRespBodyVoMonitorAfterStrategy () { super ((Class<ResponseEntity<RespBodyVo>>) (Class<?>) ResponseEntity.class); } @Override protected List<Tag> applyStrategy (ProceedingJoinPoint pjp) { List<Tag> tags = new ArrayList <>(); tags.add(Tag.of(STATUS_CODE_TAG, String.valueOf(result.getStatusCode().value()))); RespBodyVo body = result.getBody(); if (body == null ) { return tags; } String code = body.getCode(); tags.add(Tag.of(BUSINESS_CODE_TAG, code)); return tags; } }
接着是抽象策略工厂类
1
2
3
4
5
6
7
8
9
10
11
12
13
14
15
16
17
18
19
20
21
22
public class MonitorStrategyFactory { private Map<String, Map<String, Object>> beforeStrategyMap; private Map<String, Map<String, Object>> afterStrategyMap; public MonitorAfterStrategy getAfterStrategy (String strategy) { return (MonitorAfterStrategy) afterStrategyMap.get(strategy); } public MonitorBeforeStrategy getBeforeStrategy (String strategy) { return (MonitorBeforeStrategy) beforeStrategyMap.get(strategy); } public void setBeforeStrategyMap (Map beforeStrategyMap) { this .beforeStrategyMap = beforeStrategyMap; } public void setAfterStrategyMap (Map afterStrategyMap) { this .afterStrategyMap = afterStrategyMap; } }
最后就是自己定义的TimedAspect了
1
2
3
4
5
6
7
8
9
10
11
12
13
14
15
16
17
18
19
20
21
22
23
24
25
26
27
28
29
30
31
32
33
34
35
36
37
38
39
40
41
42
43
44
45
46
47
48
49
50
51
52
53
54
55
56
57
58
59
60
61
62
63
64
65
66
67
68
69
70
71
72
73
74
75
76
77
78
79
80
81
82
83
84
85
86
87
88
89
90
91
92
93
94
95
96
@Aspect @Component @Slf4j public class CustomTimedAspect { public static final String DEFAULT_EXCEPTION_TAG_VALUE = "none" ; public static final String EXCEPTION_TAG = "exception" ; private final MonitorStrategyFactory monitorStrategyFactory; private final MeterRegistry registry; public CustomTimedAspect (MeterRegistry registry, MonitorStrategyFactory monitorStrategyFactory) throws IOException { this .registry = registry; this .monitorStrategyFactory = monitorStrategyFactory; } @Around("@within(top.tbghg.demo.monitor.aop.CustomTimed)") public Object timedClass (ProceedingJoinPoint pjp) throws Throwable { Method method = ((MethodSignature) pjp.getSignature()).getMethod(); Class<?> declaringClass = method.getDeclaringClass(); CustomTimed timed = declaringClass.getAnnotation(CustomTimed.class); return perform(pjp, timed); } @Around("execution (@top.tbghg.demo.monitor.aop.CustomTimed * *.*(..))") public Object timedMethod (ProceedingJoinPoint pjp) throws Throwable { Method method = ((MethodSignature) pjp.getSignature()).getMethod(); CustomTimed timed = method.getAnnotation(CustomTimed.class); return perform(pjp, timed); } private Object perform (ProceedingJoinPoint pjp, CustomTimed timed) throws Throwable { Timer.Sample sample = Timer.start(registry); String exceptionClass = DEFAULT_EXCEPTION_TAG_VALUE; Object result = null ; try { result = pjp.proceed(); return result; } catch (Exception ex) { exceptionClass = ex.getClass().getSimpleName(); throw ex; } finally { record(pjp, timed, sample, exceptionClass, result); } } private void record (ProceedingJoinPoint pjp, CustomTimed timed, Timer.Sample sample, String exceptionClass, Object result) { List<Tag> customTags = new ArrayList <>(); try { customTags = getCustomTags(pjp, timed, result); } catch (Exception e) { log.error("自定义标签运行异常, pjp: {}, CustomTimed: {}, result: {}" , pjp, timed, result, e); } try { sample.stop( Timer.builder(timed.value()) .description(timed.description()) .tags(timed.extraTags()) .tags(EXCEPTION_TAG, exceptionClass) .tags(customTags) .publishPercentileHistogram(timed.histogram()) .publishPercentiles(timed.percentiles()) .register(registry)); } catch (Exception e) { log.error("指标记录失败, pjp: {}, CustomTimed: {}, customTags: {}" , pjp, timed, customTags, e); } } private List<Tag> getCustomTags (ProceedingJoinPoint pjp, CustomTimed timed, Object result) { List<Tag> customTags = new ArrayList <>(); MonitorBeforeStrategy beforeStrategy = monitorStrategyFactory.getBeforeStrategy(timed.beforeKey()); if (beforeStrategy != null ) { customTags.addAll(beforeStrategy.getTags(pjp)); } MonitorAfterStrategy afterStrategy = monitorStrategyFactory.getAfterStrategy(timed.afterKey()); if (afterStrategy != null ) { customTags.addAll(afterStrategy.getTags(pjp, result)); } return customTags; } }
OK,实现完毕,下面就是一些配置了
导入包、application.yaml添加配置 和之前的相同,不多赘述
springboot中添加注解
1
2
@EnableAspectJAutoProxy @ImportResource(locations = {"classpath:spring-application.xml"})
下面就是写创建Bean的xml了
1 2 3 4 5 6 7 8 9 10 11 12 13 14 15 16 17 18 19 20 <bean id ="respBodyVoMonitorAfterStrategy" class ="top.tbghg.demo.monitor.Strategy.impl.RespBodyVoMonitorAfterStrategy" /> <bean id ="wrappedRespBodyVoMonitorAfterStrategy" class ="top.tbghg.demo.monitor.Strategy.impl.WrappedRespBodyVoMonitorAfterStrategy" /> <bean id ="httpMonitorBeforeStrategy" class ="top.tbghg.demo.monitor.Strategy.impl.HttpMonitorBeforeStrategy" /> <bean id ="noHttpMonitorBeforeStrategy" class ="top.tbghg.demo.monitor.Strategy.impl.NoHttpMonitorBeforeStrategy" /> <bean id ="monitorStrategyFactory" class ="top.tbghg.demo.monitor.Strategy.MonitorStrategyFactory" > <property name ="beforeStrategyMap" > <map > <entry key ="http" value-ref ="httpMonitorBeforeStrategy" /> <entry key ="noHttp" value-ref ="noHttpMonitorBeforeStrategy" /> </map > </property > <property name ="afterStrategyMap" > <map > <entry key ="respBodyVo" value-ref ="respBodyVoMonitorAfterStrategy" /> <entry key ="wrappedRespBodyVo" value-ref ="wrappedRespBodyVoMonitorAfterStrategy" /> </map > </property > </bean >
现在就已经彻底完成了,下面添加一个试试
1 @CustomTimed(value = "http.server.requests.custom", description = "公共API请求", histogram = true, afterKey = "wrappedRespBodyVo", beforeKey = "http")
下面打开http://localhost:8092/actuator/prometheus结果如下(部分):
(涉及具体业务,不方便贴图,就简单摘了一点,主要看指标的标签)
1
2
3
# HELP http_server_requests_custom_seconds 公共API请求 # TYPE http_server_requests_custom_seconds histogram http_server_requests_custom_seconds_bucket{application="demo",business_code="1001",class="top.tbghg.controller.OpenApiController",exception="none",method="commonApi",requestMethod="POST",status_code="200",uri="/common_api",le="0.001",} 0.0
可以看到对于直方图类型,最终上报了 bucket、max、sount、sum四类数据,并且指标中包含如下标签:应用名、业务code、类、方法、http方法、异常、URI